Height And Weight Chart for Kids in India
Height & Weight Chart for Kids in India
Tracking the height and weight of children is an important aspect of their overall health and development. It allows parents to monitor their growth patterns and ensure they are thriving. India is a diverse country, and the height and weight of children can vary due to genetic factors, nutrition, and overall health. By consulting this comprehensive chart, you will be able to assess whether your child's growth is in line with their age and gender. Children may experience growth spurts at different stages, and it's important to consider that growth is not always consistent. However, if you have concerns about your child's development or notice any significant deviations from the chart, it's advisable to consult a medical professional. Stay informed and stay ahead by utilizing this height and weight chart for Kids in india.
Baby Weight & Length Chart: Newborn to 1 Year
The baby weight and length chart for newborns to 1 year provides a guideline for parents to track their child's growth during this crucial period. Infants are measured for length; during the first few months of life, they are still unable to stand up straight. A newborn baby in India typically weighs between 2.8 and 3 kg at birth. In the case of premature babies versus post-term babies, this would be different. The height and baby weight charts in KG for boys and girls in India according to the WHO in their first year of life are displayed in the following chart.
|
Newborn - 1 Year Chart |
Boys |
Girls |
||
|
Months |
Weight (KGs) |
Length (CMs) |
Weight (KGs) |
Length (CMs) |
|
0 |
2.5 – 4.3 |
46.3 – 53.4 |
2.4 – 4.2 |
45.6 – 52.7 |
|
1 |
3.4 – 5.7 |
54.7 – 58.4 |
3.2 – 5.4 |
50.0 – 57.4 |
|
2 |
4.4 – 7.0 |
54.7 – 62.2 |
4.0 – 6.5 |
53.2 – 60.9 |
|
3 |
5.1 – 7.9 |
57.6 – 65.3 |
4.6 – 7.4 |
55.8 – 63.8 |
|
4 |
5.6 – 8.6 |
60.0 – 67.8 |
5.1 – 8.1 |
58.0 – 66.2 |
|
5 |
6.1 – 9.2 |
61.9 – 69.9 |
5.5 – 8.7 |
59.9 – 68.2 |
|
6 |
6.4 – 9.7 |
63.6 – 71.6 |
5.8 – 9.2 |
61.5 – 70.0 |
|
7 |
6.7 – 10.2 |
65.1 – 73.2 |
6.1 – 9.6 |
62.9 – 71.6 |
|
8 |
7.0 – 10.5 |
66.5 – 74.7 |
6.3 – 10.0 |
64.3 – 73.2 |
|
9 |
7.2 – 10.9 |
67.7 – 76.2 |
6.6 – 10.4 |
65.6 – 74.7 |
|
10 |
7.5 – 11.2 |
67.7 – 76.2 |
6.8 – 10.7 |
66.8 – 76.1 |
|
11 |
7.4 – 11.5 |
70.2 – 78.9 |
7.0 – 11.0 |
68.0 – 77.5 |
|
12 |
7.8 – 11.8 |
71.3 – 80.2 |
7.1 – 11.3 |
69.2 – 78.9 |
Toddler Height and Weight Chart
Your child's growth patterns will continue to change as they get older and move from infancy to toddlerhood. Parents can use the toddler height and weight chart as a reference to track their child's development between the ages of one and three. Growth usually slows down during this time compared to infancy, but it is still substantial. Toddlers typically gain 2 kg of weight and grow 4 to 6 inches in height annually. It's crucial to keep in mind, though, that every child has a unique growth pattern. While some toddlers may grow more slowly, others may go through growth spurts. You can determine whether your toddler's growth is within the typical range for their age and gender by using the height and weight chart.
|
2nd Year Growth Chart |
Boys |
Girls |
||
|
Months |
Avg. Weight (KGs) |
Avg. Length (CMs) |
Avg. Weight (KGs) |
Avg. Length (CMs) |
|
13 |
9.9 |
76.9 |
9.2 |
75.2 |
|
14 |
10.1 |
78.1 |
9.4 |
76.4 |
|
15 |
10.3 |
79.2 |
9.5 |
77.5 |
|
16 |
10.5 |
80.2 |
9.8 |
78.6 |
|
17 |
10.7 |
81.3 |
10 |
79.7 |
|
18 |
10.9 |
82.3 |
10.2 |
80.7 |
|
19 |
11.1 |
83.2 |
10.4 |
81.7 |
|
20 |
11.4 |
84.2 |
10.7 |
82.7 |
|
21 |
11.6 |
85.1 |
10.9 |
83.7 |
|
22 |
11.8 |
86.1 |
11.1 |
84.6 |
|
23 |
12 |
86.9 |
11.3 |
85.5 |
|
24 |
12.7 |
90.6 |
12.1 |
86 |
Height & Weight Chart for Preschoolers
A child's growth is particularly significant during the preschool years, and keeping an eye on their weight and height during this time can reveal important information about their general health. Preschoolers, who are usually between the ages of three and five, have a height and weight chart that helps parents monitor their child's development as they get ready for kindergarten and beyond. Growth continues during these years, but more slowly than it did during infancy and toddlerhood. Preschoolers typically gain 2 KGs of weight and grow 2 to 3 inches in height annually. But it's crucial to keep in mind that every person has different growth patterns. While some kids grow more steadily, others might go through growth spurts. Keeping an eye on the height and weight of your child and comparing it to the
|
Preschooler Growth Chart |
Boys |
Girls |
||
|
Age |
Avg. Weight (KGs) |
Avg. Length (CMs) |
Avg. Weight (KGs) |
Avg. Length (CMs) |
|
2 Years |
12.7 |
86.5 |
12.1 |
85 |
|
2.5 Years |
13.6 |
91.3 |
13 |
90.3 |
|
3 Years |
14.4 |
95.3 |
13.9 |
94.2 |
|
3.5 Years |
15.3 |
99 |
14.9 |
97.7 |
|
4 Years |
16.3 |
102.5 |
15.9 |
101 |
|
4.5 Years |
17.4 |
105.9 |
16.9 |
14.5 |
Chart of Height and Weight for Big Kids
Children's growth in height slows down as they get older and closer to puberty. Children typically gain 2 to 3 kg of weight and grow 5 to 8 cm every year between the ages of 5 and 8. You can learn more about the typical height and weight growth for super kids by referring to the following baby height and weight chart.
|
Big Kids Growth Chart |
Boys |
Girls |
||
|
Age |
Avg. Weight (KGs) |
Avg. Length (CMs) |
Avg. Weight (KGs) |
Avg. Length (CMs) |
|
5 Years |
18.5 |
109.2 |
18 |
108 |
|
6 Years |
20.8 |
115.7 |
20.3 |
115 |
|
7 Years |
23.2 |
122 |
22.9 |
121.8 |
|
8 Years |
25.8 |
128.1 |
25.8 |
127.8 |
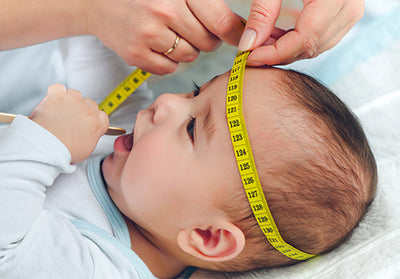
How Babies Are Measured
Accurate measurement of babies' height and weight is crucial for tracking their growth and development. When it comes to measuring height, babies are typically measured lying down. The healthcare professional will use a measuring tape or an infantometer to measure the distance from the top of the baby's head to their heels. It's important to ensure that the baby is lying flat and straight during the measurement. For weight measurement, infants are typically placed on a scale. The scale should be calibrated and set to zero before placing the baby on it. It's important to remove any extra clothing or blankets that the baby may be wearing to get an accurate weight.
The healthcare professional will record the measurements and plot them on the height and weight chart to assess the baby's growth. Regular measurements at well-baby check-ups allow parents and caregivers to monitor their baby's growth and ensure they are on track with their development.
What Happens If a Baby's Growth Patterns Change Unexpectedly?
If your baby experiences an unexplained slowdown in weight or height growth, shows signs of not gaining or losing weight, or undergoes a sudden surge in height or weight, it's crucial to promptly inform your baby's pediatrician. While these changes might be attributed to growth spurts, it's always wise to stay informed and take timely action when it comes to the well-being of your baby.
Understanding Growth Chart Percentiles: The World Health Organization (WHO) provides a length and weight chart for infants up to one year, represented in percentiles rather than averages. This approach incorporates data from diverse children of the same age and gender across different regions. Consequently, the percentile system illustrates the entire spectrum within which a child may fall at a specific age and gender. Therefore, your child is considered healthy, whether they fall on the lowest or highest percentile on the chart.
What Happens If Your Baby's Weight and Height Are Beyond of the Percentile?
The information provided above emphasizes that percentile charts for newborns are based on averaged data for the same age and sex. However, individual children may fall outside the typical range (below the 10th percentile or above the 90th percentile) due to various factors such as genetics, parental height, and weight. In such cases, it is recommended to consult with a pediatrician for appropriate actions.
Every child is unique, and comparisons with others may not accurately reflect their individual growth. The article underscores the importance of understanding that various factors contribute to each child's development, resulting in diverse body builds.
FAQ:
Q: How can I use a height and weight chart for my child?
A: The chart provides a visual representation of average height and weight for children of a specific age and gender. Locate your child's age on the chart to assess how their measurements compare to the average.
Q: What does it mean if my child's measurements fall below the 10th percentile on the chart?
A: If your child is below the 10th percentile, it suggests they are smaller than the average for their age group. While this could be normal for some children, consulting with a pediatrician is recommended to ensure healthy development.
Q: Can a child be above the 90th percentile and still be healthy?
A: Yes, a child above the 90th percentile is considered larger than the average for their age. However, it's essential to consider various factors, including genetics and overall health. Regular check-ups with a pediatrician help monitor and address any concerns.
Q: How often should I refer to the height and weight chart for my child?
A: While it's helpful for periodic assessments, it's not necessary to obsessively check the chart. Regular well-child visits with a healthcare professional offer a more comprehensive evaluation of your child's growth and development.
Q: What factors contribute to variations in a child's growth compared to the chart?
A: Genetics, nutrition, overall health, and environmental factors all play a role in a child's growth. The chart provides a general guideline, but individual variations are normal. If you have specific concerns, it's best to discuss them with your child's healthcare provider.